Survey Report] Nearly Half of Young to Mid-Career Full-Time Employees Are Preparing to Leave Their Jobs About 1/4 of the respondents have high intention to change jobs, including those who have started concrete consideration of changing jobs.
Hiring and HR Strategies in an Era of "Manpower Shortages Results of "Survey on Job Satisfaction among Young to Mid-career Full-Time Employees
LifeTimeTechLabo合同会社
LifeTimeTechLabo LLC (Head office: Nagoya City, Aichi Prefecture; President: Yoji Usami), a company that provides support for corporate marketing strategy planning and implementation, conducted an online survey of young to mid-career (25-34 years old) full-time employees to find out more about their job satisfaction and to gain insight into their hiring and HR strategies, which are becoming increasingly important as the "labor shortage" becomes the biggest management issue facing Japanese companies. In order to find hints for recruitment and HR strategy, we conducted an online survey of full-time employees in the young to mid-management age group (25-34 years old), asking about their level of job satisfaction.
The survey results are summarized below.
The total percentage of respondents who were dissatisfied with their current jobs (on a scale of 1 to 11) was 24.8%, 28.8% were undecided, and 46.5% were satisfied. Satisfaction exceeded dissatisfaction by nearly double.
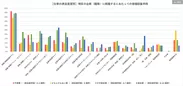
The most satisfied with their current jobs were "work style (work place and hours, holidays and other working conditions, etc.)" (24.5%), "benefits" (23.3%), and "communication and human relations with superiors and subordinates" (21.5%), in that order.
Conversely, "Wages (salary, bonus, etc.)" (38.0%) was by far the most common item of dissatisfaction with their current job. Workload (18.3%)" and "Current personnel evaluation/assessment (18.0%)" followed.
In addition to "Wage (30.5%)" and "Work style (27.3%)," "Benefits (19.8%)" and "Stability of company (employment) (18.5%)" were the most important factors in their current job search.
Nearly half (42.5%) of the respondents answered that they were "thinking of changing jobs" or "have started job hunting," including "vaguely..." in terms of their current job-hopping intentions. Nearly half (42.5%) of the respondents answered that they are "thinking about changing jobs" or "have started looking for a new job," including "vaguely," and 24.3% have begun to think about changing jobs.
[The "Satisfied" group is the most likely to be satisfied with their current job.]
The "Satisfied" group was satisfied with their current job in terms of "Amount of work," "Stability of company (employment)," and "Wage (salary, bonus, etc.). The percentage of satisfaction with "wages" was roughly proportional to the stratification from "dissatisfied" to "satisfied.
The most common item of dissatisfaction among the "Satisfied" group was "nothing in particular. On the other hand, a majority of the dissatisfied group chose "Wages," and more than 1/3 of the dissatisfied group chose "Current personnel evaluation/assessment.
The "Dissatisfied" group was more than 20 points higher than the "Satisfied" group in terms of their current job change intentions, including "vaguely...". On the other hand, the "Satisfied" group showed stronger intention to change jobs than the "Somewhat Satisfied" group.
Details of the survey results (excerpts)
This survey targeted full-time employees aged 25-34 who have graduated from university or above, who are now in the young to mid-career age brackets, and who will be the next generation of corporate leaders, The first question in the survey asked about job satisfaction, items that were important to them in finding a job, and means of gathering information about companies.
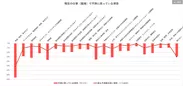
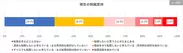
The first question in the survey asked respondents to rate their level of satisfaction with their current job on an 11-point scale from 0 (very dissatisfied) to 10 (very satisfied).
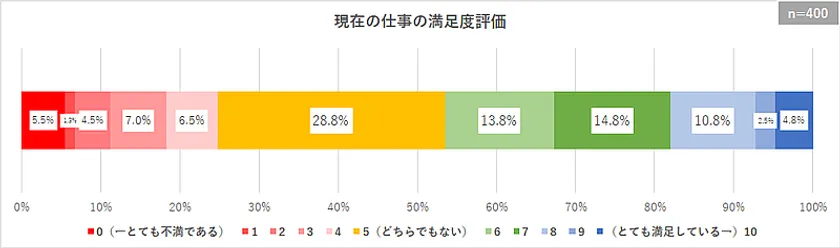
Current Job Satisfaction Rating
The results of the question showed that the total of "0-4" responses indicating "dissatisfaction direction" was "24.8%," "5" responses indicating "neither" were "28.8%," and "6-10" responses indicating "satisfaction direction" were "46.5%" in total.
The total for "satisfied" exceeded that for "dissatisfied" by nearly double, indicating that many respondents are generally satisfied with their current jobs.
However, the total of "6 and 7," which is close to the "neither" category, was high at 28.5%, and when the same level of "neither" is included, these three responses account for nearly 60% of the total.
In this respect, rather than a majority of the "satisfied" group, a nuanced "not dissatisfied" group of "reluctantly positive" respondents may be said to be the majority.
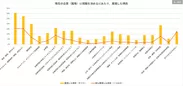
In the next question, respondents were asked to select items in which they are "satisfied" with their current job (workplace).
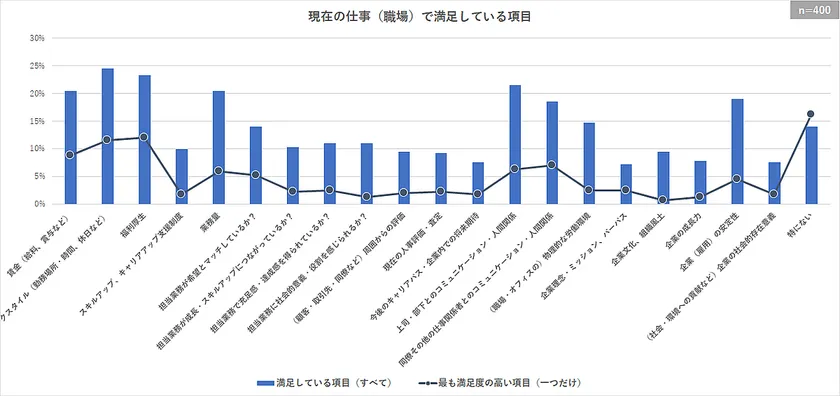
Satisfaction with current job (workplace)
The most frequently selected items were, in descending order, "Work style (work place and hours, holidays and other working conditions) (24.5%)," "Benefits (23.3%)," "Communication and human relations with superiors and subordinates (21.5%)," "Wages (salary, bonus, etc.) (20.5%)," and "Amount of work (20.5%). These five items accounted for more than 20% of the total.
On the other hand, when asked to select only one item as the "most satisfying," the highest response was "nothing in particular (16.3%)," followed by "benefits (12.0%)" and "work style (11.5%)," in that order.
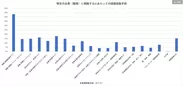
The same items were then used as examples for the question asking about "dissatisfaction" with their current jobs (workplaces).
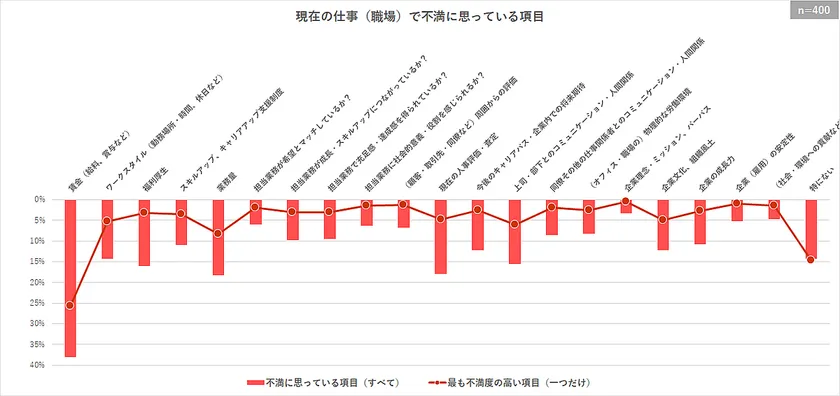
Items of dissatisfaction with current job (workplace)
Wages (salary, bonuses, etc.)" was the most common item, at 38.0%, with a double score of more than double that of the second place and below.
This was followed by "workload (18.3%)," "current personnel evaluation/assessment (18.0%)," "benefits (16.0%)," and "communication/personal relationships with superiors/subordinates (15.5%).
Wages (25.8%)" was also the most frequently cited item of highest dissatisfaction, followed by the same item, "Workload (8.3%)" in second place.
The results of the above two questions, for example, "nothing in particular" ranked first for the most satisfying item (→ leading to a large number of negative affirmations in the job satisfaction evaluation), and we recognize that these results confirm the satisfaction evaluation to a certain degree.
In addition, items related to "basic treatment and working conditions," such as "wages" and "work style," and items related to "human relations," such as "communication and human relations with superiors and subordinates," appeared highly in both the satisfied and dissatisfied groups, indicating that satisfaction (or dissatisfaction) with these specific items greatly influences job satisfaction This is taken to indicate that satisfaction (or dissatisfaction) with these specific items has a large impact on the level of satisfaction with the job itself and its evaluation.
On the other hand, the question "Does your job lead to your growth and skill improvement? Do you get a sense of fulfillment and accomplishment from the work you are in charge of? and "Does my work lead to growth and skill development?" and "Does my work give me a sense of fulfillment and accomplishment?
Lastly, regarding the prominence of "wages" in the direction of dissatisfaction, it can be inferred that it may be strongly influenced by the current social and economic situation in Japan, where "real wages remain negative" under the inflationary environment. (→ The percentage of dissatisfaction may have increased over the past two years or so.)
In this environment of strong dissatisfaction with wages, if the wage gap between companies (or industries) continues to widen... the survival of companies (or industries) without the ability to raise wages could very well be in jeopardy sooner than expected.
The next set of questions asks about the time of employment.
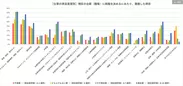
The first question asked about the "items that were important" in deciding to work at the current company (workplace), giving examples of the items.
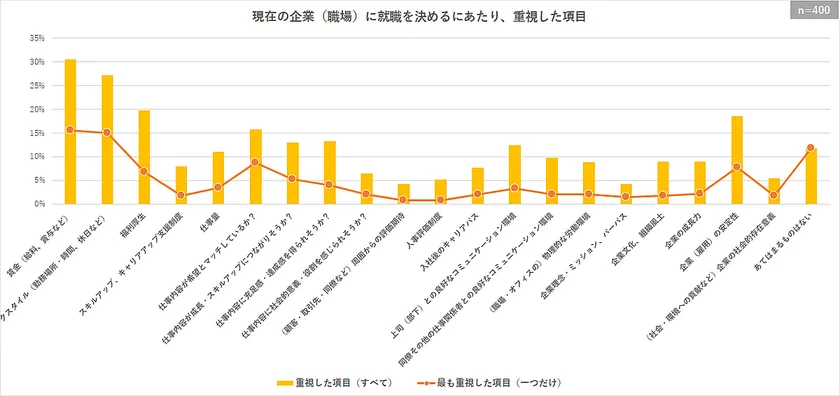
Items that were important when deciding on employment at the current company (workplace)
The two most common responses were "Wages (salary, bonuses, etc.) (30.5%)" and "Work style (work place and hours, holidays and other working conditions, etc.) (27.3%)," followed by "Benefits (19.8%)" and "Stability of company (employment) (18.5%)," then "Does the job content match my expectations? (15.8%)" and "Is the job likely to give me a sense of fulfillment and accomplishment? (13.3%)," "Is the job likely to lead to growth and skill improvement? (13.0%)," etc.
The most important items were also "Wage (15.5%)" and "Work style (15.0%)" followed by "Does the job content match what I want? (8.8%)" was next in importance. (Excluding "None of the above (11.8%)").
The questions on job satisfaction (dissatisfaction) items and [basic treatment and working conditions] such as "wages" and "work style" appear high, which is common.
On the other hand, the most important items when finding a job were "Does the job content match what I want?" and "Is the job matching what I want?
These items may be difficult to identify in terms of evaluation of satisfaction (dissatisfaction) items in comparison with other items, but... At the very least, the results are interesting as they provide a glimpse of changes in attitudes (priorities) toward work between the pre- and post-employment periods.
In this respect, it is quite possible that selecting a company that places excessive emphasis on job satisfaction and recruiting activities that appeal to job satisfaction may not make both parties happy in the end.
*** ***
The last question in this survey asked about the respondents' current intention to change jobs.
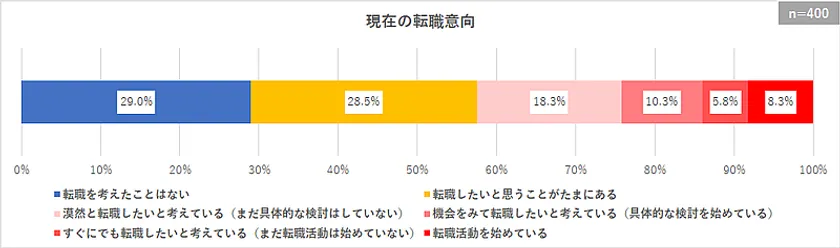
Current intention to change jobs
The largest proportion of respondents (29.0%) answered that they "have never thought about changing jobs," followed closely by "sometimes want to change jobs (28.5%)," while "vaguely want to change jobs (not yet considering)" accounted for 42.5% of the total responses indicating an intention to change jobs, including "vaguely want to change jobs (have not yet made concrete plans).
In addition, 24.3% of the respondents indicated a high level of desire to change jobs, which is directly linked to concrete action, such as "I would like to change jobs when I see an opportunity (I am beginning to consider concrete action).
Nearly half of those surveyed indicated an intention to change jobs, and approximately 25% indicated a high intention to change jobs, indicating a change in work attitudes (work environment) that allows workers to take the next step in their career path at any time, depending on their satisfaction (dissatisfaction) with their current job. The survey also suggests that companies need to develop more detailed strategies and responses for recruiting and retaining future leaders.
(2) Job Satisfaction by Level of Satisfaction with Current Job
This report is based on the results of an 11-point scale from "0 (very dissatisfied)" to "10 (very satisfied)," in which respondents were asked to rate their level of satisfaction with their current jobs.
Dissatisfied group: Select "0-4
Neither" group: Select "5
Somewhat satisfied: Select 6 or 7
Satisfied group: Select "8 to 10
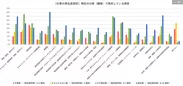
The first data is a crosstabulation of the questions that asked respondents to select the "items they are satisfied with" regarding their current job (workplace).
[The first question asked respondents to select items they were satisfied with in their current jobs (workplaces).
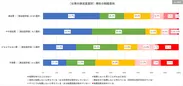
[The "satisfied" group selected more items than the "dissatisfied" group in almost all categories (excluding "nothing in particular"), with particularly large differences of 20 points or more in "workload," "stability of company (employment)," "wages (salary, bonuses, etc.)," and "communication and human relations with superiors and subordinates.
Only in the "benefits" category, the percentage of "satisfied" was slightly lower than that of "dissatisfied.
Comparing the "Satisfied" and "Somewhat Satisfied" groups, the "Amount of work," "Corporate culture and organizational climate," "Is the work I am in charge of connected to my growth and skill development? The percentage of the "satisfied" group was more than 10 points higher than the "somewhat satisfied" group for "work style (work place and hours, holidays and other working conditions, etc.)," while the percentage of the "satisfied" group was more than 10 points higher than the "somewhat satisfied" group for "work amount," "corporate culture and organizational climate," and "does the job I am in charge of lead to growth and skill development?
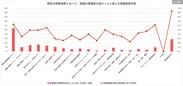
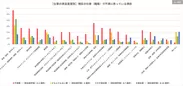
The following data was obtained by cross-tabulating the results with the question asking respondents to select "items with which they are dissatisfied" regarding their current job (workplace).

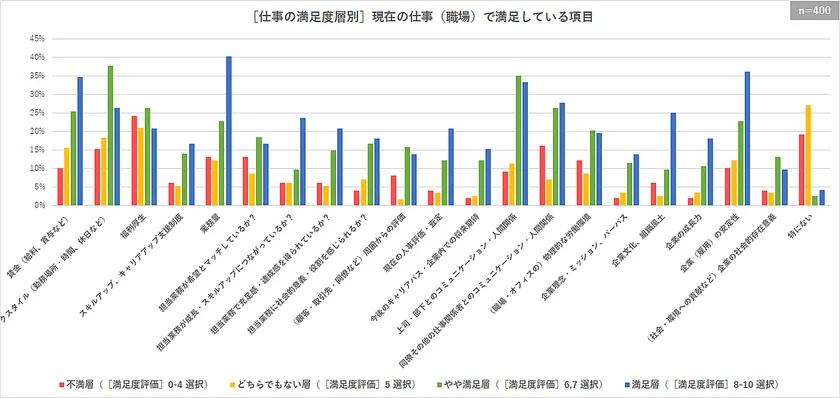
[Items of dissatisfaction with current job (workplace) by level of job satisfaction
Contrary to the previous question, the percentage of respondents in the "dissatisfied" group exceeded those in the "satisfied" group in almost all categories (excluding "nothing in particular").
The difference is particularly noticeable in "Wages (salary, bonus, etc.)," where the difference is about 40 points, and "Work style (work place and hours, holidays and other working conditions, etc.)" and "Current personnel evaluation and assessment," where the difference is more than 20 points.
Incidentally, only in the category of "Stability of company (employment)," the percentages of "Dissatisfied" and "Satisfied" were reversed.
In addition, a large difference of nearly 15 points was found between the "Satisfied" and "Somewhat Satisfied" groups in the "Wage" category.
These data show that the satisfaction factors of the "satisfied" and "somewhat satisfied" groups and the dissatisfaction factors of the "dissatisfied" group are formed by a combination of factors (not one factor).
Among these factors, "wage" has a clear proportional trend to the level of job satisfaction, and is considered to be the most basic condition for evaluating job satisfaction.
Other factors such as "amount of work" and "stability of company" were also more pronounced at higher satisfaction levels, and can be recognized as factors that raise satisfaction ratings.
On the other hand, "welfare" was generally the same regardless of satisfaction level, suggesting that it is not a factor that directly influences job satisfaction. (However, it is possible that a certain degree of system enhancement is a prerequisite.)
The "corporate culture and organizational climate" and "Is the work I am in charge of connected to my growth and skill development? etc., are likely to be functioning to further increase satisfaction based on the assumption that the respondents are satisfied with their jobs.
In this regard, it may be said that the roles played by such factors as "individual satisfaction" and "significance and purpose of the company organization," which were difficult to understand in the basic report, have become a little clearer.
*** ***
For the full text of the survey report, please refer to our website.
▼ Survey on Job Satisfaction among Young to Mid-career Full-time Employees
Survey of Job Satisfaction among Young to Mid-career Full-time Employees [Report by Job Satisfaction Level] (in Japanese only)
In this survey report, additional data on "Respondent Attributes/Crosstabulations by Gender and Age" is available for corporate respondents who wish to use it.
Please access the following page, fill in the required information, and download the data.
▼ Survey of Job Satisfaction among Young to Mid-career Full-time Employees [Additional Data] Download
https://lttl.jp/contact/white_paper_dl.html
Survey Summary
Survey on Job Satisfaction among Young to Mid-career Full-time Employees
Survey method : Internet survey
Survey period: January 22-25, 2024
Survey population: 25-34 year olds nationwide
[Currently working for a company/full-time employees/university graduates and above.
(Using I-Bridge's "Freeasy Affiliated Panel")
Valid responses: [Main survey] 400 samples
(Equally distributed by sex and age)
Number of questions: [Main survey] 7 questions
Company Profile
Company name: LifeTimeTechLabo LLC
Location: 1-11-12 Meieki Minami, Nakamura-ku, Nagoya, Aichi 450-0003, Japan
Business Outline : Planning and operation of internet and application services
Support and consultation for marketing strategy and service development
Website : https://lttl.jp/
Official Instagram : https://www.instagram.com/lifetimetechlabo/
Image
Logo Image
- Category:
- Research & Reports